

In this guest post Nada Hasic reviews the new phone app for monitoring rain tanks and the experience so far with it at Sydney’s Sustainable House.
We’ve heard all about how Sydney dam levels are set to drop below half capacity for the first time in the last 15 years. This is partly due to how little rainfall we’ve had this winter, so I’m thinking that now must be a great time to install a reliable monitoring system in our rain tanks.
And that was exactly what we did at Sydney's Sustainable House, in Chippendale, Sydney, NSW.
On the 9th of September (about 15 days ago), Michael installed a new monitoring system for his rainwater tank.
The system is a product of a company called Kingspan Water, and they’ve named it SENSiT. They advertise that the product would enable one to monitor “rain event inflows, rainwater usage and storage volumes in the rainwater tank”, as well as put “all the data online so it can be accessed from your devices wherever you happen to be”. In addition to all this, the company claims that the sensor and app also alert users to bypass and pump issues almost in real time.
Ever since Michael’s handy man installed the monitoring device, I have been keeping an eye on the data from the tank via the phone app I installed on both, Michael’s iPhone and my Android phone. I will now provide you with the information about how it was installed, how it works, data it provides and my opinion on it all.
How it was installed
Since this device is only in its infant stages of sales and customer testing, there isn’t much information about installation, or anything really. A lot of it has been just figuring it out on the go. In the end, the sensor was drilled onto the lid of the tank, so that the concrete tank didn’t have to be drilled through.
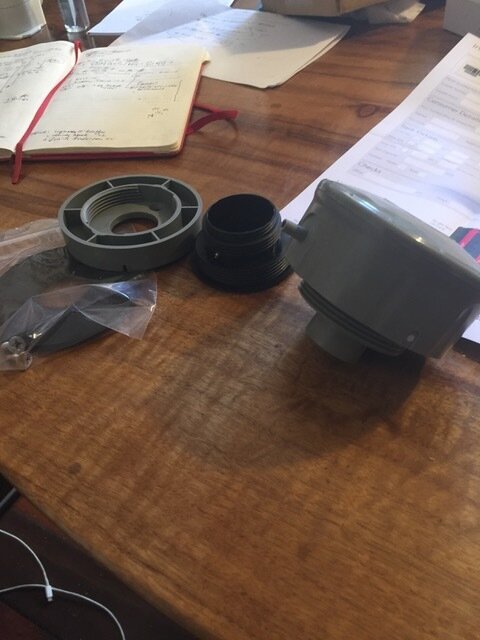
• The sensor arrived in parts, and it looked like this before being assembled
It was easy enough to connect the parts. Below is the photo of the assembled structure.

• Sensor after it was assembled
The assembled sensor was then attached onto the lid of the tank, so that the concrete didn’t have to be drilled through.
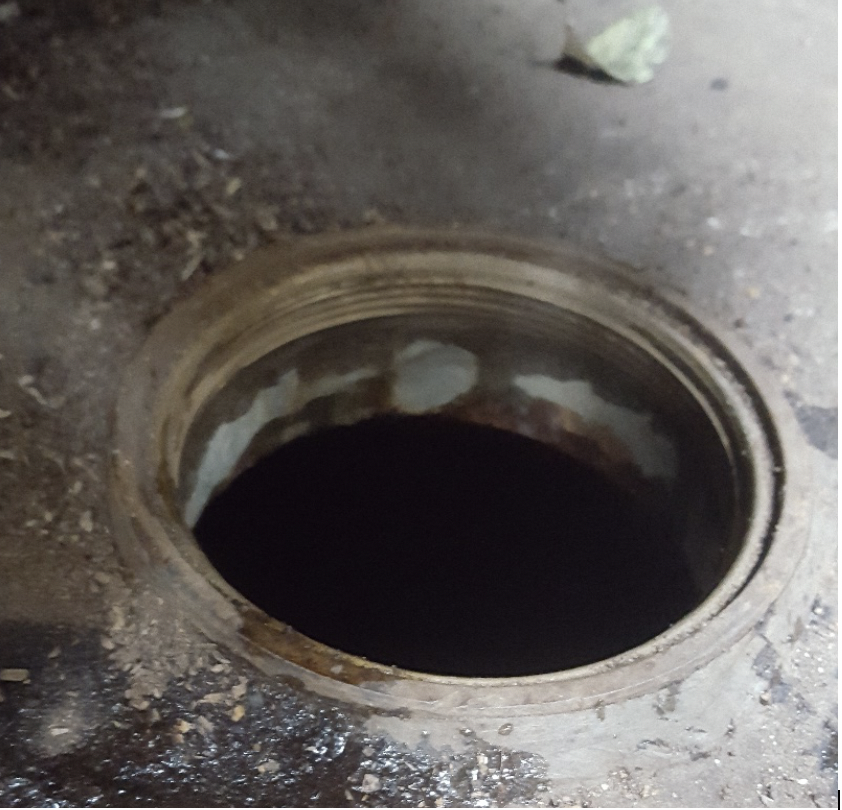
• 60 cm hole into which the sensor was inserted
After it was installed, making it function properly was pretty simple and well explained by Kingspan Water.
A sensor was hooked onto the WiFi modem via an USB port, and Michael downloaded the SENSiT app on his phone. It took about 5 minutes to register the device onto the app and approximately another 2 hours to start receiving data. I was then able to download the same app and sign into Michael’s account to monitor the tank from my phone as well.
How it works
The system in place is simple: the sensor measures current water level in a tank, and then it wirelessly sends information to the app on your phone. Screenshots of the app and the data it provides are below.

• First window on the phone app
The first window I get when I open the app on my phone shows what percentage of the tank is still filled with water. Apart from that, the first window provides information on the serial number of the tank the app is monitoring, its name, model, capacity, material and fuel type.

• Screenshot 2: Second window (Last Month graph)
The second window, the one that shows up when I tap on the three rectangles to the left and below the circle of percentages, shows a graph that records data on the amount of water (in litres) in the tank for each day of the last month.
Below the graph, the app displays the average amount of water used in litres per day and, based on this average, predicts the date that the tank will be empty.

• Screenshot 3: Third window (Three Months Graph)
If I tap the ‘3 MONTHS’ option above the graph, the graph will change to display the same data as above, but going back three months, instead of just a month.

• Screenshot 4: Fourth window (Twelve Months Graph)
In the last window of the app, the one that shows up when I tap the ’12 MONTHS’ option above the displayed graph, I get a new graph that displays the same data as the graphs above, only here it goes back 12 months instead of three or one.
Data
On the screenshots above, we see data collected from the day the sensor had been installed up until 23/09/2019 which included two days of rain we’ve had in this week. So far, the product seems to be working well. The information we are seeing seems to accurately reflect what we know should be happening in the tank – water level went up after the rain and now it’s steadily dropping.
The only thing that we haven’t had the chance to properly check yet is the prediction about when the tank will be empty. The date when the tank will empty completely is calculated using the average daily consumption information that we see below graphs in Screenshots 2, 3 and 4. The average changes with each day however, and so the date changes as well. Since the tank still hasn’t been completely empty in the time after the sensor had been installed, the accuracy of these predictions hasn’t been properly tested.
Conclusion
SENSEiT sensor and app are still in development and we still have a long way before we are able to confidently tell you to buy it or not.
What we can say as of now is that it’s been working very well so far, it’s given us some useful data, and the Kingspan team working on it have been great about asking for feedback, listening to it and answering any and all questions we’ve had so far with amazing patience.
NOTE: And thanks to Richard Denham for feedback on this blog where he lets us know about another product called, Tank Talk.
by Nada Hasic
Nada is a Mechanical Engineering undergraduate student from the United States University of Rochester, class 2021, and an intern at Sydney’s Sustainable House.