

As Coolseats have been placed in cafés, we hope to quantify their environmental and economic impacts. Amid the restrictions and complications brought by the COVID-19 pandemic, data collection has been an even harder than normal task. Now, we have developed the Coolseats Food Waste Calculator, an easy-to-use tool giving cafés (and everyone else!) the ability to determine their pollution and cost savings from composting and other waste reductions.
The estimates of pollution generated by food waste are highly variable and depend largely on the type of food. These results are commonly given as the kilograms (kg) of carbon emissions produced per kilogram of food thrown out. This calculator assumes 1kg of wasted food yields 2.5kg of carbon pollution[3], which is a low-end intermediate estimate between high estimates (7.67kg [4]) and low estimates (1.9kg [1,2] ). This means that cafés may be preventing even more carbon pollution than is presented by the calculator.
The United States Environmental Protection Agency notes that tracking food waste is an important step in developing reduction and avoidance methods [5]. We hope that the visualizations of the positive impacts of waste reduction highlighted in the calculator motivate further action geared towards ending waste.
The rest of this blog post presents a walk-through of the calculator using impressive results from Café Giulia; if you want to try it out for yourself, it is available for download at this link and is accompanied by a video tutorial. Before delving into the guide, please note that only the green portions of the calculator require input – the rest is automatically generated!
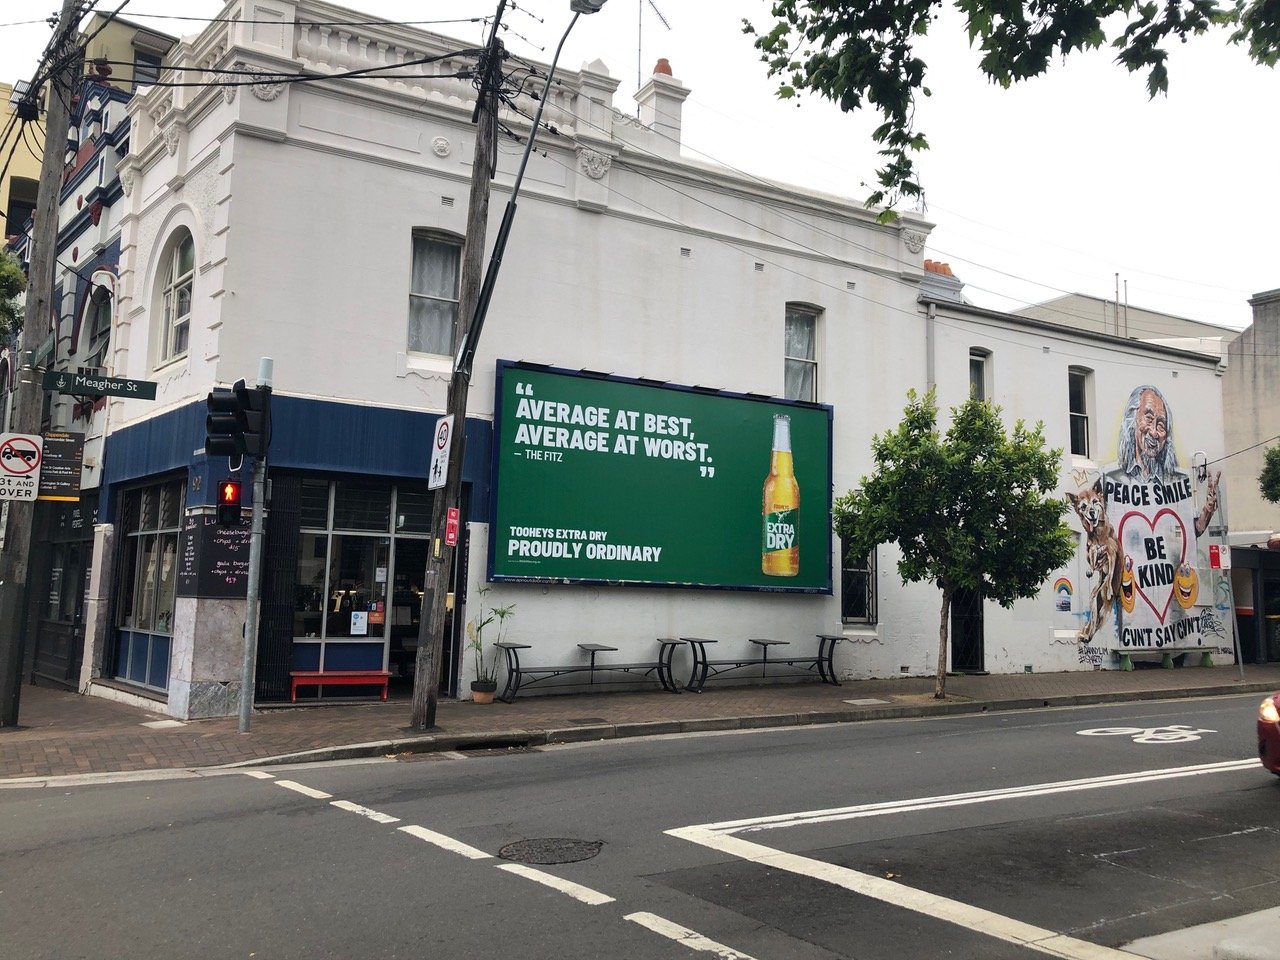
Figure 1: The outside of Café Giulia, in Sydney, NSW, whose results are shown in the following examples.
Page 1: Introduction
The calculator’s introduction, shown in Figure 2, gives instructions about what to expect from the calculator. Specifically, the data the calculator can account for falls into three categories:
Quantity of food waste composted
Frequency of garbage pickups
Any additional (non-compost) waste reduction methods
Additionally, the introduction provides spaces to enter your information for calculator personalization.
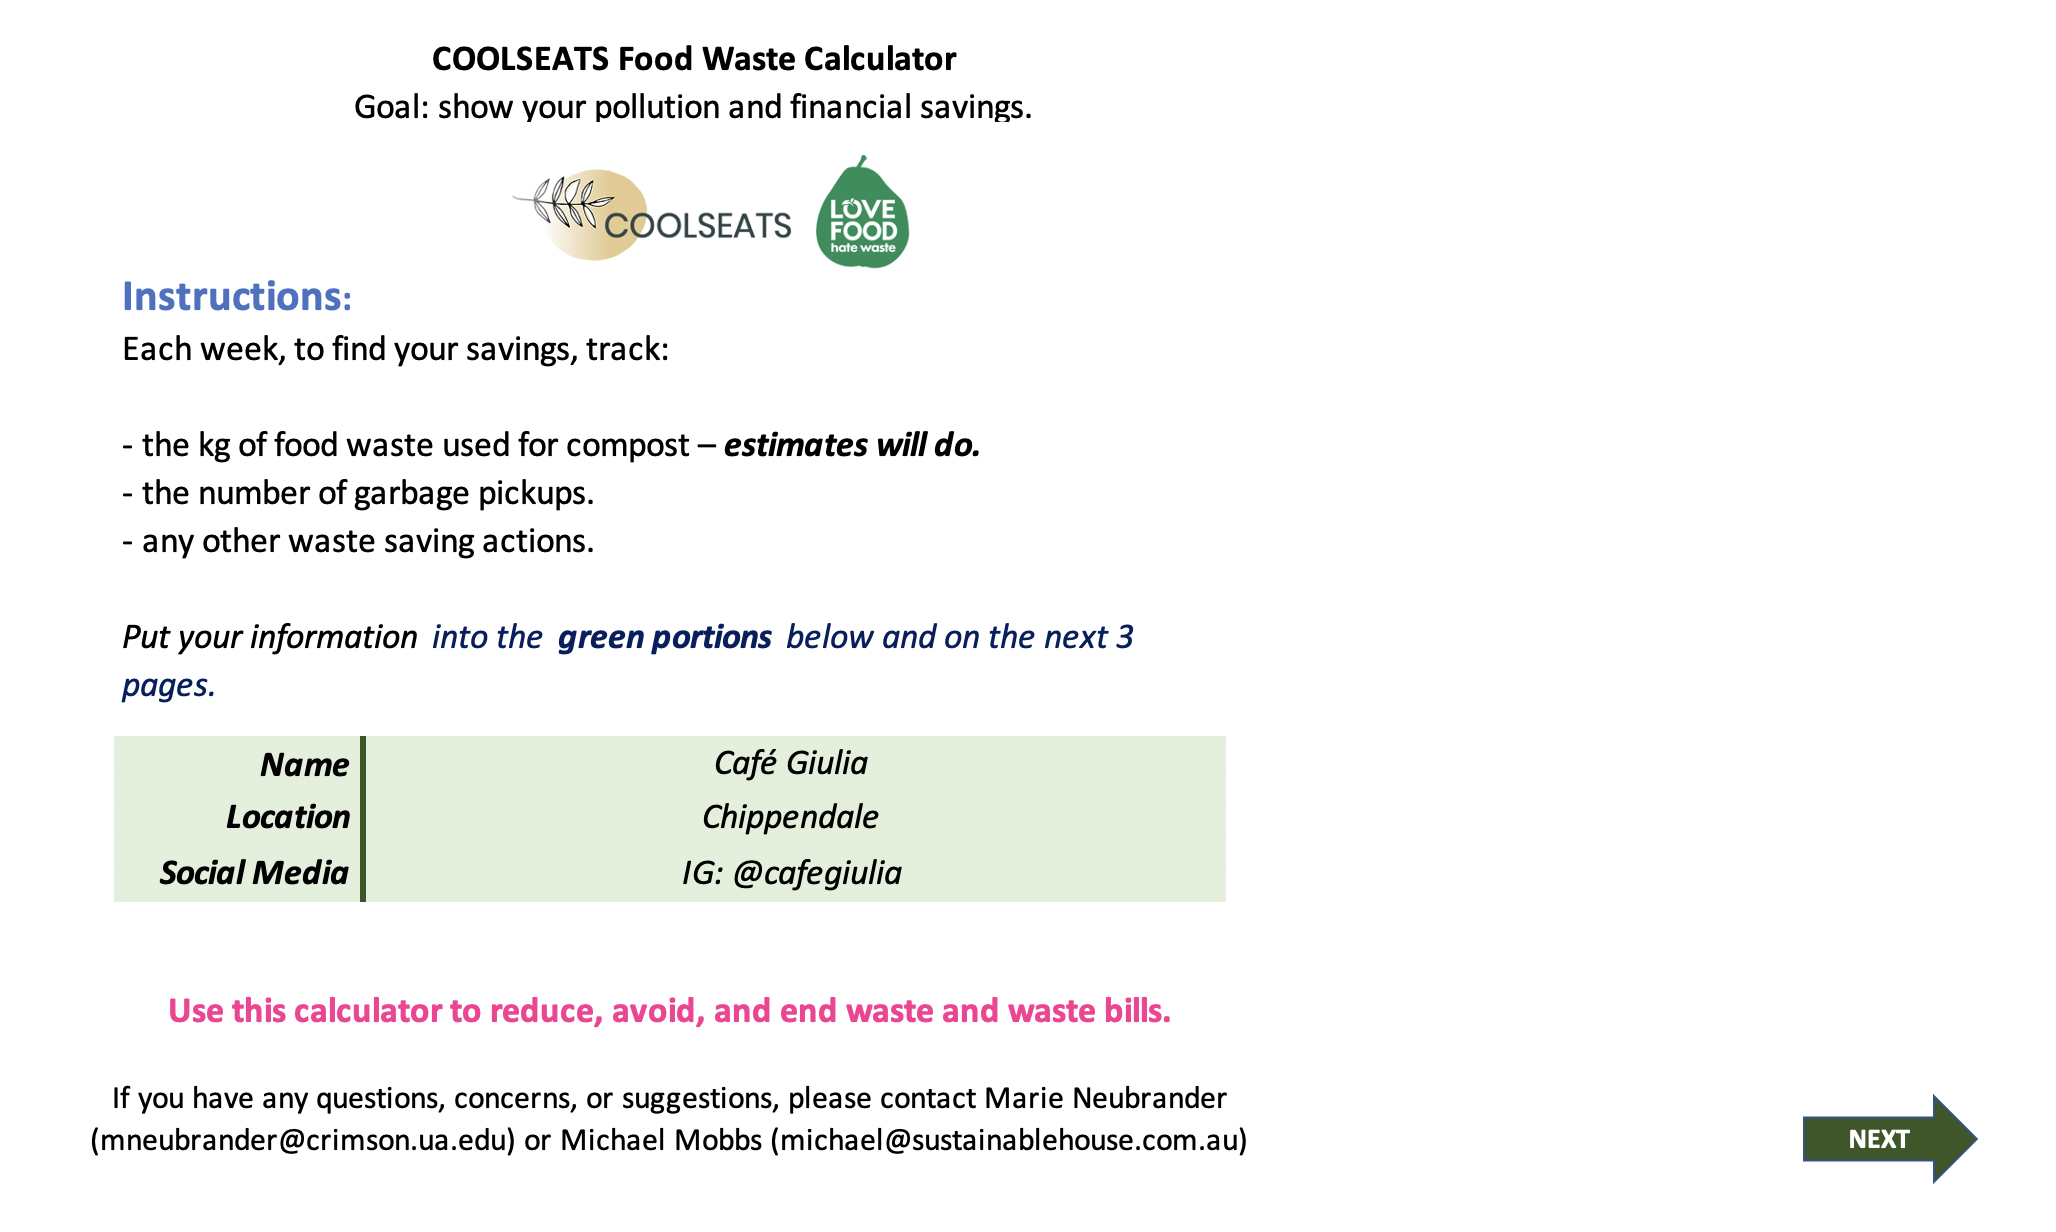
Figure 2: Coolseats calculator introduction page.
Page 2: Composting Food Waste
The second page of the calculator is where you can track the food waste composted in your coolseat, or elsewhere, to visualize composting’s positive environmental impacts.
Input: Only 3 Numbers per Day
Page 2’s input table, shown in Figure 3, only asks for three numbers a day – the quantities of spoilage waste (food that went bad in storage or expired), preparation waste, and plate waste composted. We hope that by examining the divisions between waste in these three categories, you may learn something new and determine personalized waste avoidance methods enabling further cost and pollution reductions.

Figure 3: Input for calculator page 2 - composting food waste.
The calculator provides pages to enter up to four weeks worth of data, enabling you to track progress over a month.
Weekly Results: Daily and Total Results
The first type of result computed are your daily results, shown on the left in orange in Figure 4. These results have two categories:
Daily Total Waste – the sum of your spoilage, plate, and preparation waste at each given day.
Daily CO2 Redirected to Soil: Quantity (kg) of carbon-equivalent emissions that would have gone to the atmosphere from food you composted that day. This is amount of carbon-equivalent pollution you have prevented and redirected to soil.

Figure 4: Composting food waste results table based on Café Giulia’s input.
Here, Café Giulia has prevented between 50 and 120 kg of carbon-equivalent pollution each day.
The second types of results presented are your total results, shown on the right in blue in Figure 3. These give the cumulative waste composted and carbon emissions prevented over the course of the week. In just one week, Café Giulia saved 491.7kg of carbon pollution.
Beyond only printing results in chart form, the calculator also gives visualizations of each result type. Figures 5 and 6 show example visualizations of daily and total results, respectively.

Figure 5: Daily results plot based on Café Giulia’s data.

Figure 6: Total results plot from Café Giulia’s data.
We hope that these plots provide and intuitive and easily-sharable method of communicating the results of your work.
Multi-Week Summary
As of March 28, 2021, in addition to seeing the results for each week, you may view the big-picture summary results over the course of all weeks tracked by the calculator.
Page 3: Other Waste Saving
Experience indicates that when businesses compost, they may also engage in other waste saving methods (for more information, read our previous blog post here). Page 3 gives you an optional chance to record any waste-saving techniques not captured in the previous section (if this is not applicable, or even just a bit too much extra data entry, please feel free to pass this over!).

Figure 7: Other waste saving methods filled in with Café Giulia’s creative waste-saving methods. There are quantifications of the methods discussed in detail in our previous blog post, found here.
If any rows in this section are food waste, such as Café Giulia’s coffee ground donations shown in Figure 6, indicating their quantity in liters or kilograms allows the corresponding carbon pollution prevented to be determined. These results will be added to the total results from Page 2 to show the total carbon pollution prevented, as shown in Figure 8.

Figure 8: Total carbon pollution prevented from composting and other methods in one week by Café Giulia.
Beyond saving environment, avoiding sending food to landfills has potential to save you money when you pay for garbage pickups. Here, we assume the total cost of garbage pickups is only dependent on the number pickups per week and the cost per pickup.
Data entry for this section consists of only three numbers, as shown in Figure 9:
How many times per week garbage was picked up before any composting/Coolseat usage.
How many times this week garage was picked up.
Cost per garbage pickup.

Figure 9: Café Giulia’s garbage pickup cost savings input.
Shown in Figure 10, the calculator demonstrate how much money is saved from reducing your landfill-bound waste. Here, Café Giula achieved a 50% reduction on spending through composting and other waste reduction methods.


Figure 10: Table (above) and chart (below) demonstrating that Café Giulia reduced spending on garbage pickups by 50% through waste avoidance.
Conclusion
Instead of including an image of the calculator’s conclusion, which primarily summarizes this blog post, I want to take this space to emphasize that the results of this calculator go far beyond exclusively Coolseats. We love whenever, however, and wherever you reduce, avoid, and end your food waste, working to maintain our beloved earth as we know it.
This calculator is not only for use at cafés with Coolseats, but for individuals, business, offices, and anyone in between working to save the planet while saving money.
If you decide to give this calculator a try, we hope you will share your results with us; we can’t wait to see how you save!
SOURCES:
[1] https://www.bbc.com/future/bespoke/follow-the-food/calculate-the-environmental-footprint-of-your-food.html
[2] https://www.awe.gov.au/sites/default/files/documents/national-greenhouse-accounts-factors-july-2017.pdf
[3] https://toogoodtogo.org/en/movement/knowledge/the-carbon-footprint
[4] https://www.bbc.com/future/article/20200224-how-cutting-your-food-waste-can-help-the-climate
[5] https://www.epa.gov/sustainable-management-food/tools-preventing-and-diverting-wasted-food