

How much energy is used in the cities of London, New York and Sydney?

• Ged Noering
This guest blog is by Ged Noering, an intern working with Sustainable House whilst he’s living in lockdown in London, England.
Hi Everyone!
My name is Ged Noering I'm originally from London, England. Currently, I attend St. Lawrence University in New York State studying for a BA in Government and Environmental Studies. In Richmond Upon Thames, London where I live electricity and gas is provided by two major distributors; UK power networks and SGN. With 89.1% of homes using gas to heat their homes, my home uses a gas central heating system and electrical utilities are powered through the grid, using a mix of renewable and non-renewable energy sources.
Gas and electricity are the cornerstones of what powers our cities today, but with the world increasingly conscious of their effect on our climate, how have major cities reacted?
This blog will examine the trends of household gas and electricity in three major cities; London my home town, New York, and of course Sydney.
Electricity Prices and Consumption

In London and the UK more generally we have seen a stark decline in electricity consumption. This to many is surprising seeing that the UK has seen a significant increase in population and that there are more household electrical appliances than ever before.
However, experts have suggested that the decline in consumption can be attributed to a range of measures by the UK government, utility companies, and consumer agencies to ensure more efficiency year on year. This coupled with the fact that household electricity prices have continued to rise in the UK as can be seen in the bar graph below, disincentivizing domestic consumption of electricity.

• Figure 2- Household Electricity Prices from 2016 to 2020 in Euro Cents per kWh
New York
In 2017 it was found that the average household in NYC uses around 572 kWh a month.
With NYC having the second-lowest per capita energy use in the US, second only to Rhode Island the smallest state in the US. Compared to the rest of the US, NYC is significantly more efficient in its energy use due to its population density and the number of residents living in apartments rather than homes. Whilst these consumption rates are impressive when pegged to the rest of the US they are far from impressive when pegged to the UK average household consumption of around 350 kWh a month.
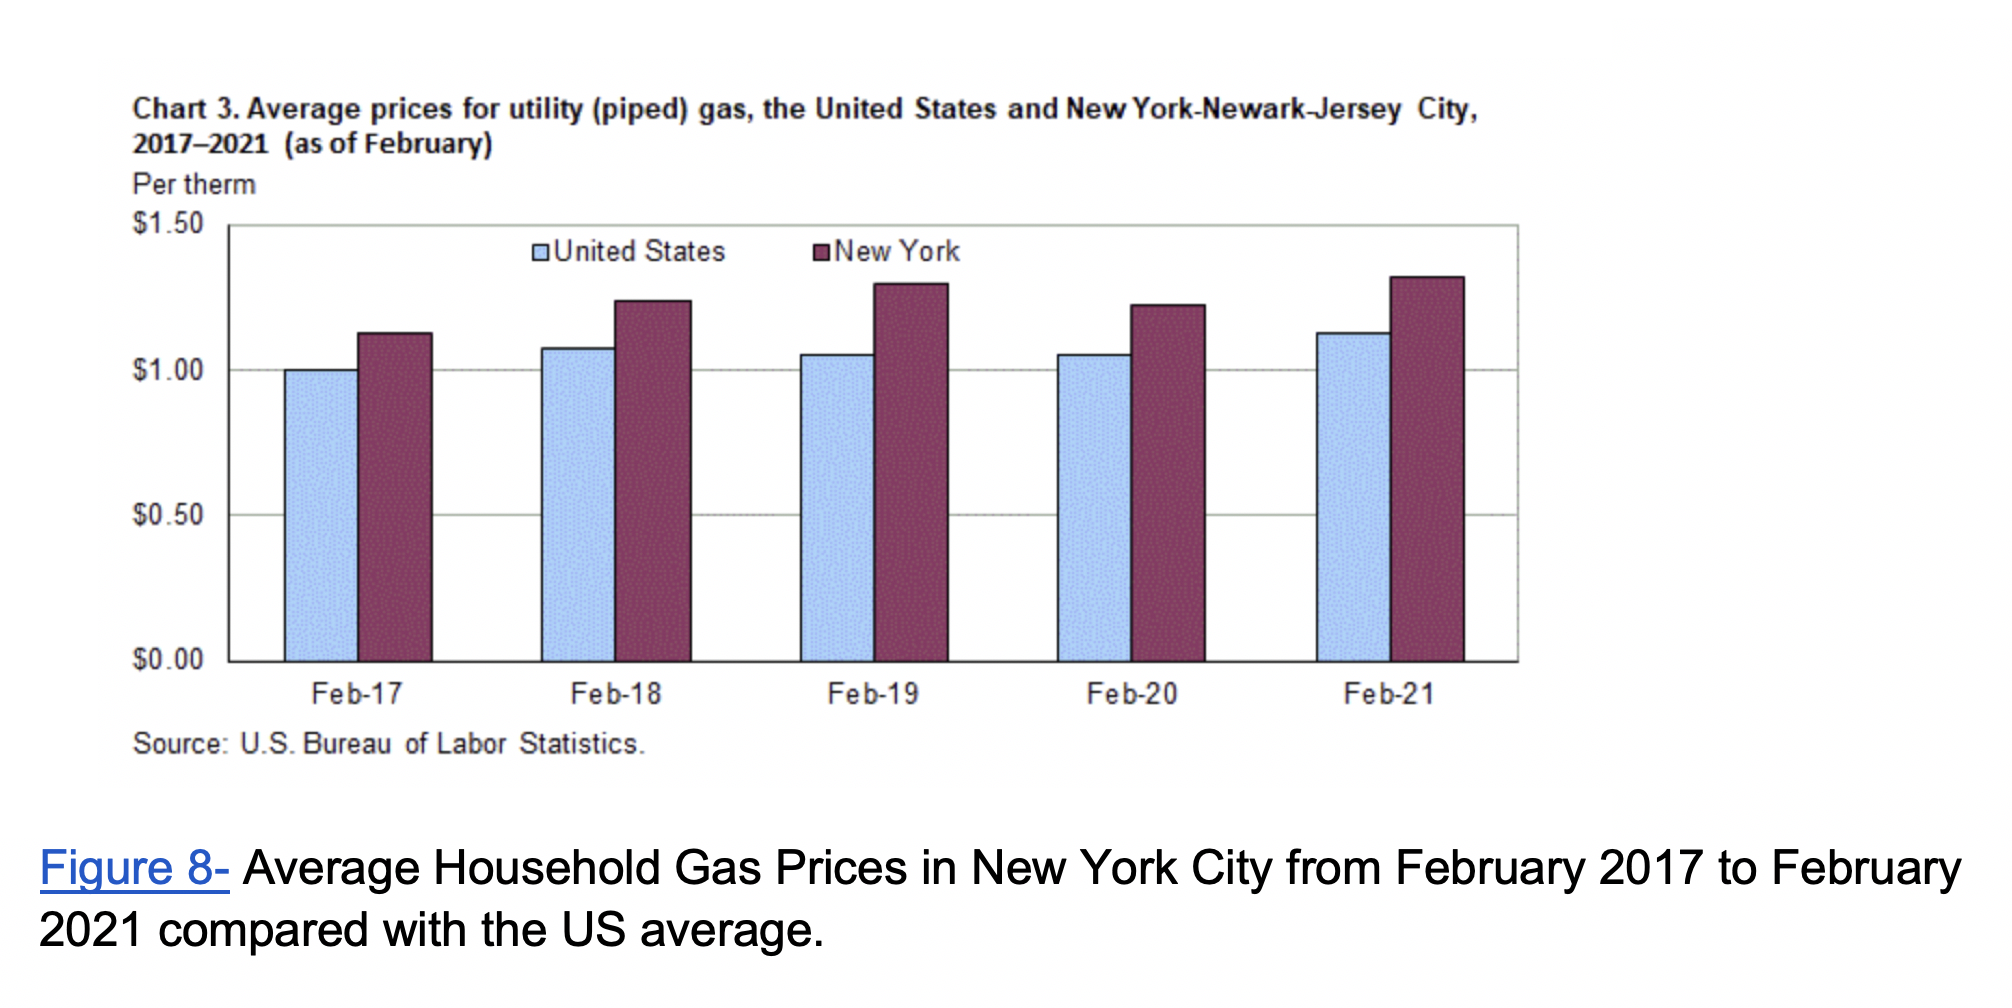
Figure 3- Average Household Electricity Prices in New York City from February 2017 to February 2021 compared with the US average.
Similar to London, NYC household electricity prices have continued to rise year on year. As a result in a familiar fashion to London, the high prices have driven household consumption down in the last couple of years. However, the total consumption of electricity across NYC has continued to increase.
Sydney
In the state of NSW, the average monthly consumption for a 2 bedroom household works out to be around 351 kWh a month. This is significantly lower than the NYC average but does not compare to the UK’s 350 kWh average across all households.

• Figure 4- Average Household Electricity Usage in NSW through the seasons
As expected in NSW electricity consumption is highest in the winter months. This is also the case for London and New York.

As can be seen above household electricity prices are estimated to decrease by about 35% in NSW with residential bills expected to decrease by 2%. This is largely due to new infrastructure projects in NSW which are projected to increase total electricity generation, such as solar PV (Photovoltaic Technology). As a result of the increased electricity generation prices are expected to decrease in NSW.
Gas Prices and Consumption
London

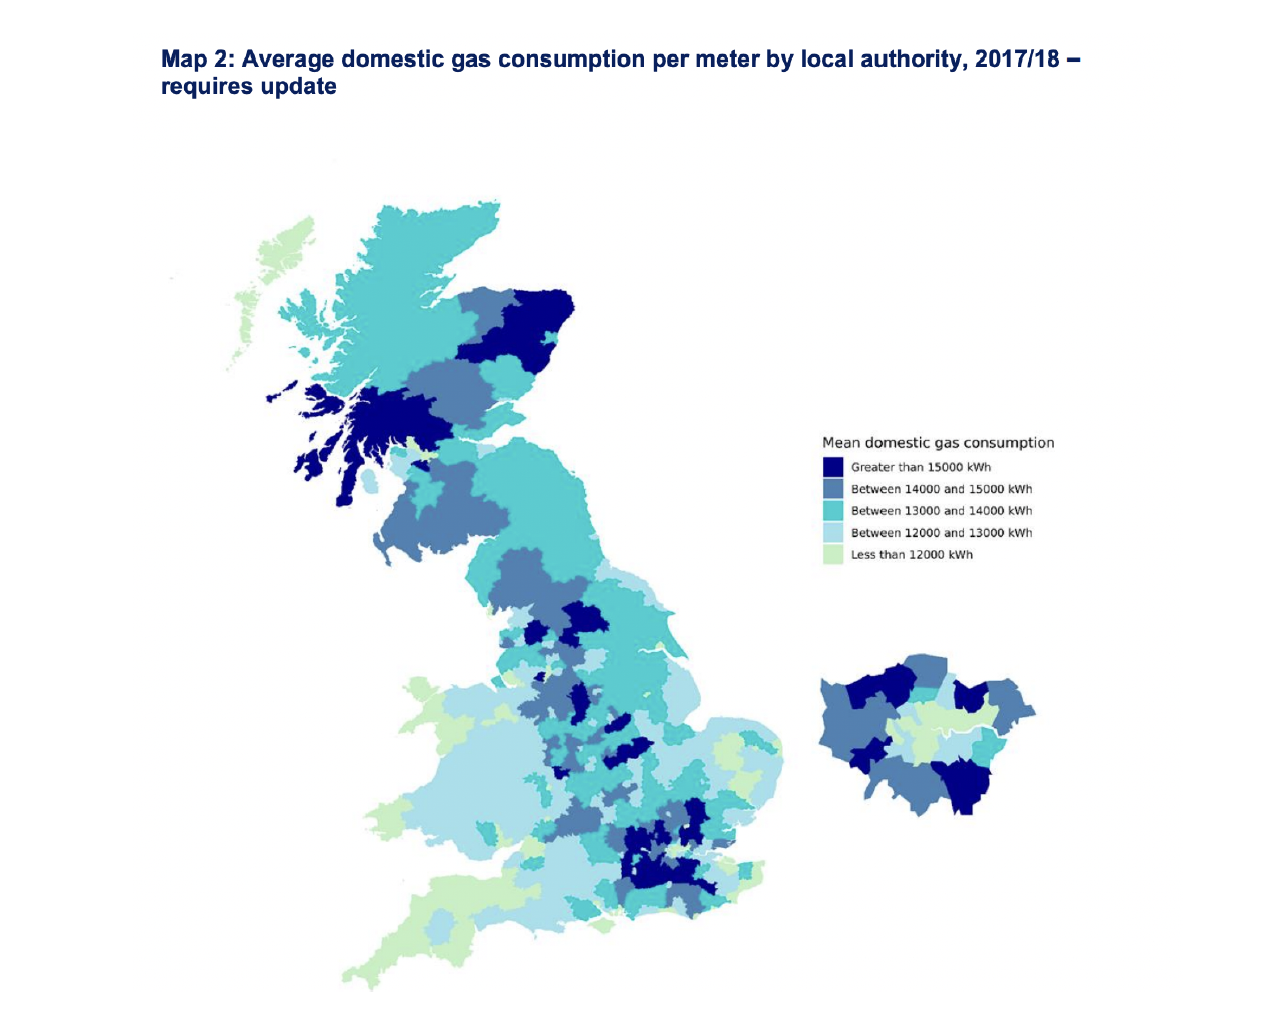
• Figure 6 and 7- Mean Household Gas Consumption per meter in the UK, Average Household Gas Consumption per local authority in the UK
As seen above mean domestic gas consumption in the UK has decreased significantly, particularly in the South West where London is located. This decrease in gas consumption over the years can largely be attributed to efficiency gains in the use of energy in the UK. This as there has been increased use of insulation, new more efficient boilers, and appliances that are more efficient in their use of gas. Furthermore, changes in gas prices and ever-changing building stock may have contributed to the decrease in gas consumption. The most recent report in 2018 by OFGEM (the UK energy regulator) found that the average annual gas bill was 610 pounds, a rise of 2.8% on 2017.
New York

Household gas prices in NYC continue to be one of the highest in the United States, with prices still continuing to rise year on year. Excluding 2020 where we can see the subtle impact of Covid-19. With the high prices for households comes high consumption rates. In New York, Gas consumption has increased steadily as can be seen from the table down below.
Usage

Sydney

• Figure 10- Household Gas consumption and benchmarks in NSW 2020
As expected gas consumption falls directly in line with seasonal variability, with higher gas consumption rates in the winter in NSW.

Household gas prices in NSW as shown above have seen a stable drop in recent years with many claiming that this is a result of reduced international demand for Australia’s gas exports. Recent estimations predict that demand for gas in NSW is going to drop at an average of 1% per annum over the next 10 years. Thus driving down domestic wholesale prices of gas in NSW.
Comparing trends in Greenhouse Gas Emissions
London

The UK has seen the most significant decline in greenhouse gas emissions among the three countries. This falls directly in line with a decrease in gas and electricity consumption, with the UK having the most significant policy to reduce greenhouse gas emissions.
New York

New York City has seen a more subtle decline in Greenhouse Gas Emissions when compared to the stark decline in the UK. New York City has a lot of work to do to wean out inefficiencies in its residential energy infrastructure which would aid in lowering its total greenhouse gas emissions.
